Conservation
Can tables talk?
Learn how to use tables to communicate important scientific information.

Overview
In this activity, your students will practice creating accurate tables to communicate important scientific information. Designed to nurture aspects of the Communicating curricular competency, this activity can be easily applied to any science concept, phenomenon, or content.
Instructions
What you'll need
- "Decoding a table" handout (at least one copy per pair of students)
- "Creating a table" handout (at least one copy per pair of students)
- "Creating a table - blank" handout, at least one copy per pair of students)
- "Assessing my ability to make an accurate table" rubric
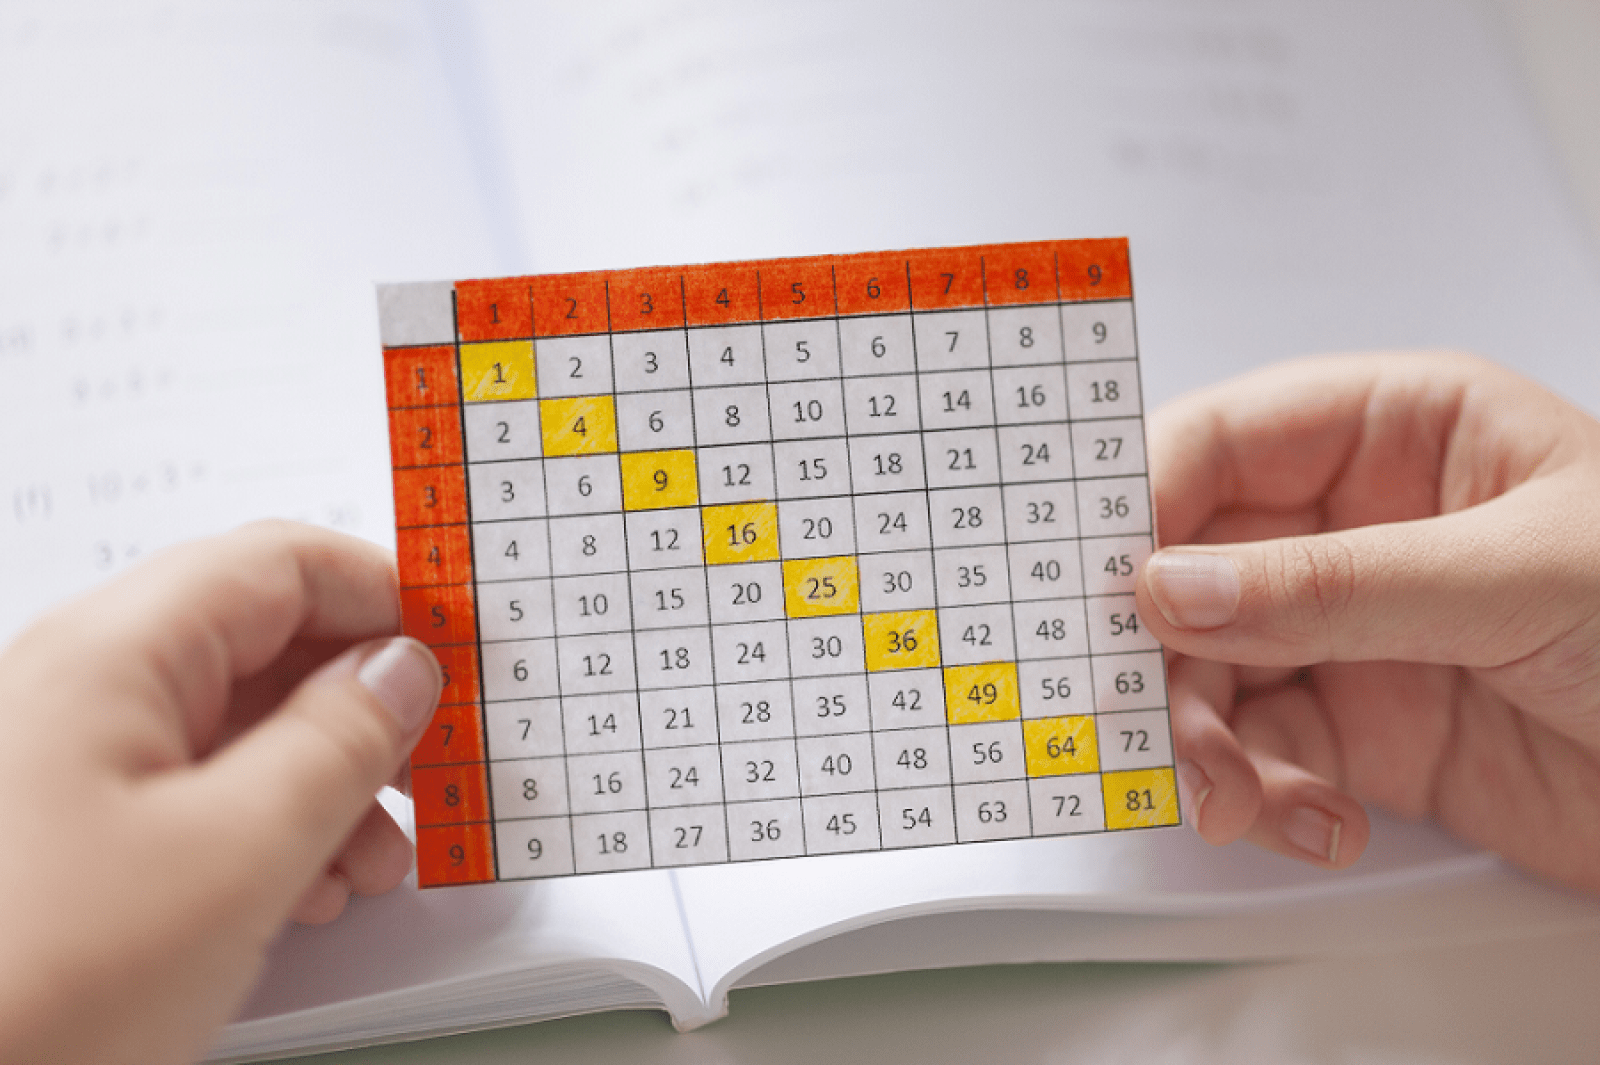
- Begin the activity by organizing your students into pairs and providing each group with a copy of the "Decoding a table" handout. Invite groups to make a decision: what would be the best title for the table? Prompt your students to use details from the table could help them make their decision. For example: What information is found the horizontal rows of the table? What is found in the vertical columns?
- Encourage groups to share their decisions and thinking with the class. Students might suggest that the columns show categories or different types of data (e.g., key features of salmon), while the rows show examples that are similar in some way (e.g., salmon species). Guide students in seeing the relationships between the information that is presented in the rows and columns.
- Highlight that tables are often used to organize and communicate important information in science and other areas. During this activity they’ll learn how to use criteria to help create tables to communicate important scientific information.
- Provide each group with at least one copy of the "Creating a table" handout, and briefly explain that their challenge is to create a table that accurately communicates important information about each of the hydroelectric facilities.
- First, encourage groups to decide what information should be in the table: is there any information that they would not include in the table?
- Next, ask groups to decide which information might be best placed in the rows and the columns. Students might suggest that the rows be labelled with the names of the hydroelectric facilities and that column headings include date completed, height, energy generated, and location.
- Prompt groups to complete their tables using the data provided, reminding them to use the criteria for an accurate table to guide their thinking.
- Conclude the activity by inviting groups to suggest other situations where a table might help communicate important information or solve a problem. Encourage your students to use the "Creating a table - blank" template and the criteria to help them create tables in other situations.
Curriculum Fit
Curricular competencies
Grade 4 Science
Communicating
- Represent and communicate ideas and findings in a variety of ways, such as diagrams and simple reports, using digital technologies as appropriate
Grade 5, 6 Science
Communicating
- Communicate ideas, explanations, and processes in a variety of ways
Assessments
Invite each student to complete a copy of the "Assessing my ability to make an accurate table" rubric.
Evaluate students’ ability to:
- Clearly identify two key aspects that are relevant, comprehensive, and overarching.
- Logically organize and appropriately label columns and rows.
- Carefully record all relevant information in appropriate cells.


