Greenhouse gases over time
What can bubbles in ice cores tell us about climate and how it’s changing?


Overview
Watch a video where scientists discover bubbles of ancient atmosphere in ice cores with trapped greenhouse gases that are over 200,000 years old. Study graphs and look for patterns in the data to see how temperature and greenhouse gases have changed over time.
Instructions
What you'll need
- “Greenhouse gases over time” slideshow
- “Greenhouse gases over time” worksheet
- Screen and internet connection to play a video
- Ask students if they were looking for evidence about Earth’s changing climate, where would they look? How would they do it?
- Have students discuss ideas in pairs and then share as a class.
- Scientists are studying ice cores, stalagmites from caves, fossil records, tree rings and shells of organisms buried deep in the ocean to learn more about our past climate.
- Show the “Greenhouse gases over time” slideshow.
- Slide 2: This short video from the Natural History Museum is about scientists from the British Antarctic Survey drilling for and studying ice cores in Antarctica to find out about Earth’s temperature and carbon dioxide levels from the past.
- Play the video once while students just listen to it.
- Play the video a second time, pausing at key points (1:27 and 1:43), for students to take notes on the “Greenhouse gases over time” worksheet and ask questions.
- After watching the video, discuss as a class using some of the following questions: What can we learn from ice cores? How old were the samples scientists drilled from the ice sheet? How much has the temperature warmed in the last 50 years? What do the bubbles in the ice tell us?
- Slide 3: Talk about the graph with a partner. What story does it tell? What’s it about? What’s the relationship between the two axis?
- Share ideas as a class. The graph shows the fluctuation in carbon dioxide (CO2) over the last 400,000 years. Point out how CO2 levels have changed and gone up and down over the years.
- Slide 4: Look at how temperature has changed over the same period of time. Talk about it with your partner.
- Share ideas as a class. Temperature and carbon dioxide levels have fluctuated at the same time.
- Slide 5: Ask two or three students to explain the graph. What’s happened in the last 250 years to greenhouse gas emissions?
- Scientific research shows greenhouse gases are increasing at a faster rate than ever before. Ask students for ideas why this might be happening.
- Human activities, like the use of fossil fuels, play a role. Two hundred and fifty years ago there were fewer humans and fewer ways to use fossil fuels. Share ideas of ways we use fossil fuels.
- Look at the graph. Based on our discussion, what do you think a graph of temperature over the last 2000 years would look like? Have students draw it on their worksheet.
- Slide 2: This short video from the Natural History Museum is about scientists from the British Antarctic Survey drilling for and studying ice cores in Antarctica to find out about Earth’s temperature and carbon dioxide levels from the past.
- The graphs from the slideshow allow us to look for patterns and relationships in the data and share our thoughts and ideas. Ask students to reflect on their competency development on the worksheet.
Modify or extend this activity
- Have students learn more about other evidence or scientific tools used in the research of Earth’s changing climate.
- Have them choose one area of interest, do some research and create one slide to share information with the class. Challenge students to include only key information. Remind them to record their sources.
- Decide as a class what needs to be included on their slide. Ideas: an image, what it is, how it’s used, what it shows, etc.
- Collate the slides into a slideshow and have students share their research with the class.
- Exploring by the seat of your pants provides virtual speakers and field trips to classrooms about science, adventure and conservation. Check their calendar and see if there’s an opportunity to learn more about Arctic research and climate change.
Curriculum Fit
Grade 7 Science
Big idea
- Earth and its climate have changed over geological time.
Content
- Evidence of climate change over geological time and the recent impact of humans
Curricular competencies
Questioning and predicting
- Demonstrate a sustained intellectual curiosity about a scientific topic
- Make observations aimed at identifying their own questions about the natural world
Processing and analyzing data and information
- Seek patterns and connections in data from their own investigations and secondary sources
- Use scientific understandings to identify relationships and draw conclusions
Evaluating
- Consider social, ethical, and environmental implications of the findings from their own and others’ investigations
Communicating
- Communicate ideas, findings and solutions to problems
Assessments
- Assess students using the “Greenhouse gases over time” worksheet and during class discussion.
Teaching Notes
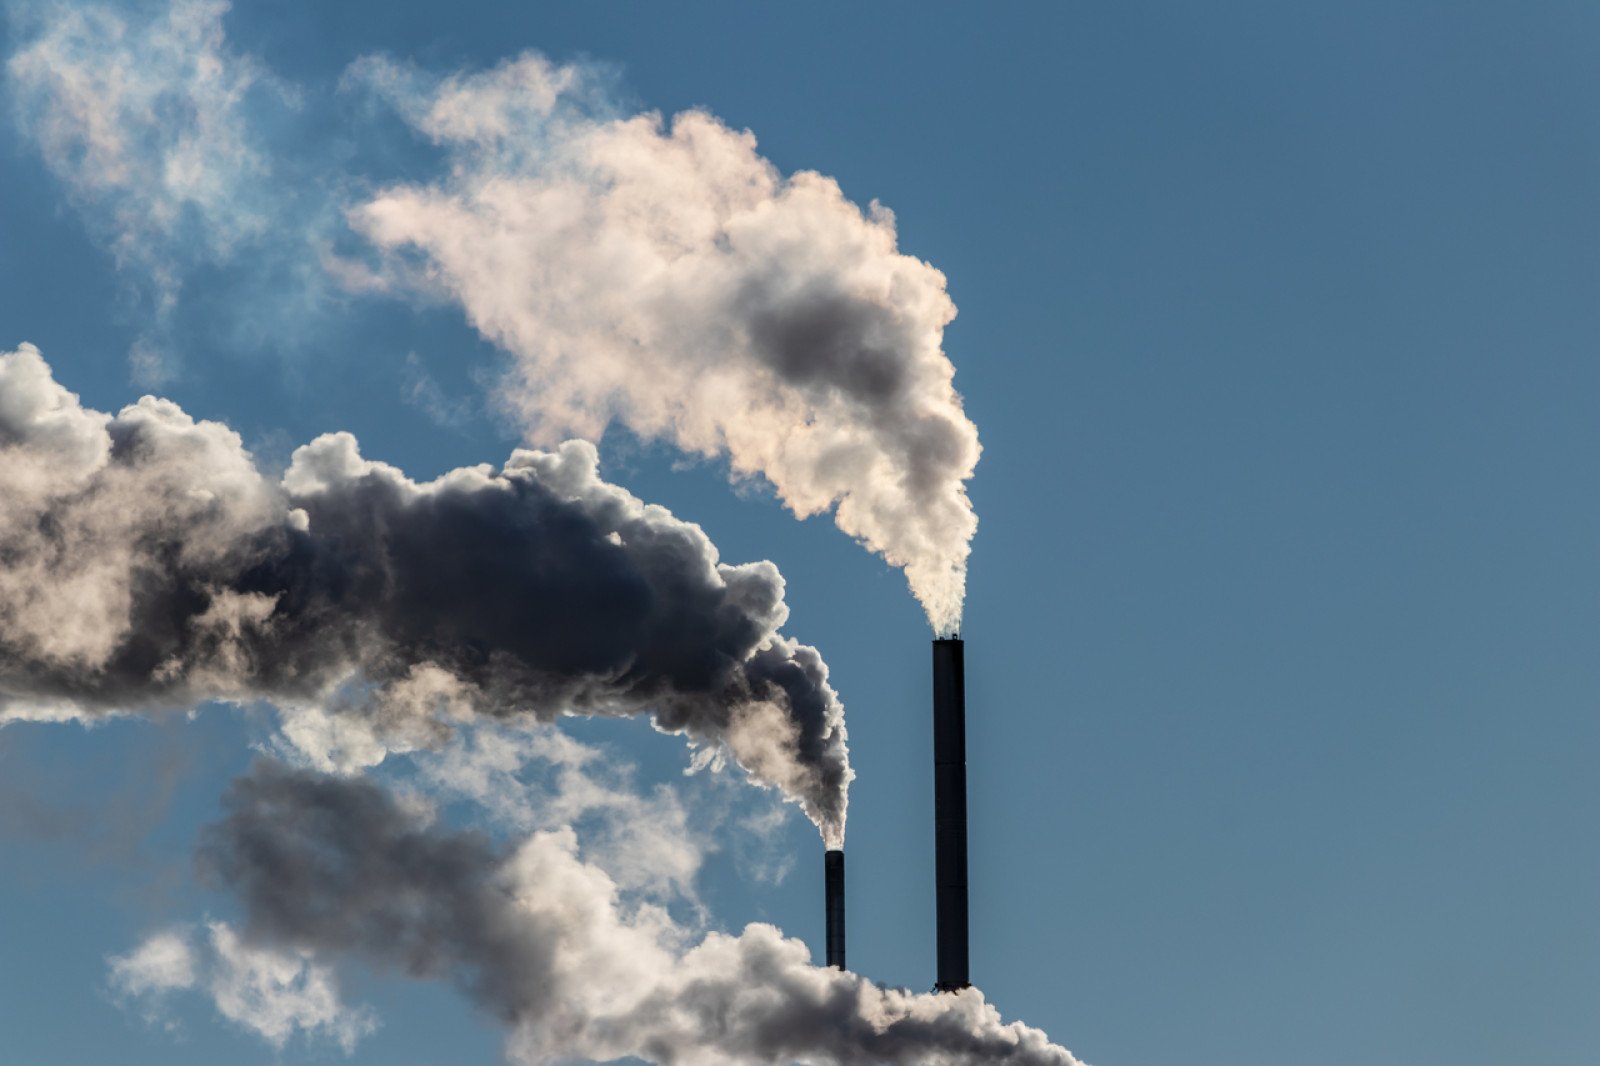
Greenhouse gases
The greenhouse effect is a natural phenomenon, keeping the Earth warm enough for life to exist. Greenhouse gases in the atmosphere, including carbon dioxide, methane, nitrous oxide and water vapour, trap heat from the sun. Most scientists believe the Earth is getting warmer because of human activities, in particular the use of fossil fuels. This began with the Industrial Revolution (1760 to 1840). Manufacturing shifted to factories and steam power was used in the textile, electric and automobile industries. Steam power and steam engines primarily burned coal as their energy source, releasing greenhouse gases. Since then, the population has grown from 700 million to 7.5 billion people. More people and more things use more energy and produce more greenhouse gases.
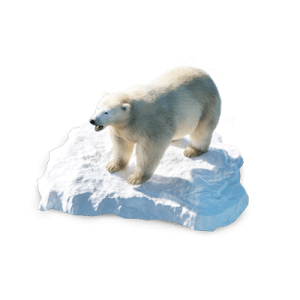
Ice cores
Ice cores provide evidence about environmental conditions from the past. Ice cores are like tree rings, where a new snow layer is created each year. The layers provide historical information about how much snow fell each year and contain materials like debris from forest fires or volcanoes, dust carried by the wind, bubbles of gases from the atmosphere and samples of insects or pollen. The information helps us understand how greenhouse gases in the atmosphere have fluctuated from the past to the present.
Activity Materials
Select what you need below.
97.8 kb • pdf
224.6 kb • pdf