Exploring Ohm’s Law
Build a circuit to demonstrate the relationship between voltage and current.

Overview
Watch a video explaining Ohm's Law, then build a circuit and conduct a demonstration so students can observe the relationship between voltage, current and resistance.
Instructions
What you'll need
- 2 or more dry cells and holders
- Conducting wires
- 2 lights
- 1 switch
- Voltmeter
- Ammeter
- “Exploring Ohm’s Law” worksheet for each student
- "Ohm's Law explained" video
Ohm's Law Explained
- Watch the "Ohm's Law explained" video to introduce Ohm's Law to your students.
Introduce the topic
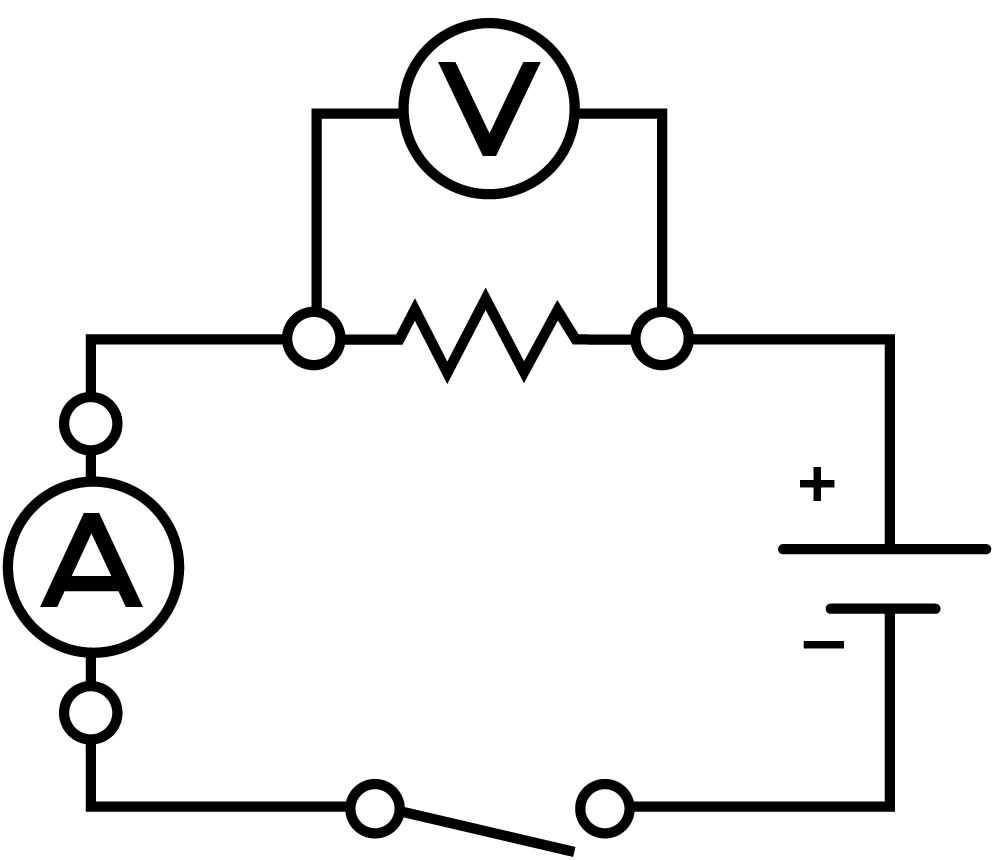
- Set up a circuit as shown here:

- Review the “Exploring Ohm’s Law” worksheet with students.
Conduct the demonstration
- Using the ammeter and voltmeter, show students how to read the measurement of the circuit’s current and voltage. While you go through the measurements, record the data on the board and have your students record the data on their worksheet. Remind them to convert mA to A; 1 amp = 1,000 milliamps.
- Add a dry cell in series and repeat the measurements.
- If you have more dry cells, add them in series one at a time, and repeat the measurements each time.
Graph the resistance
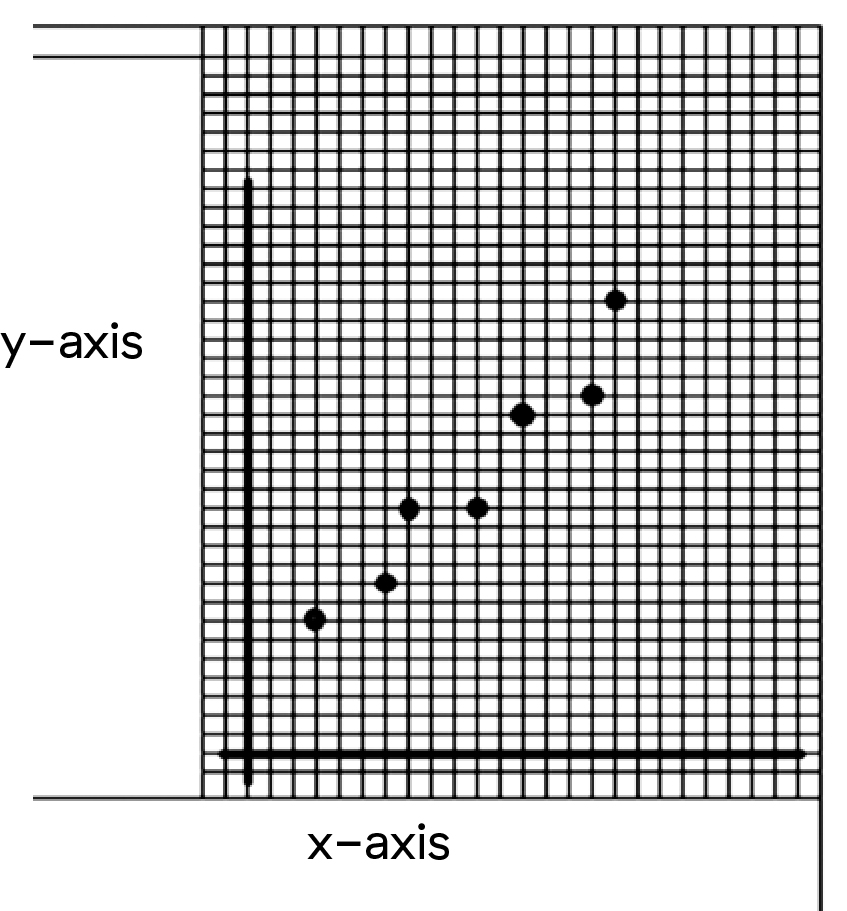
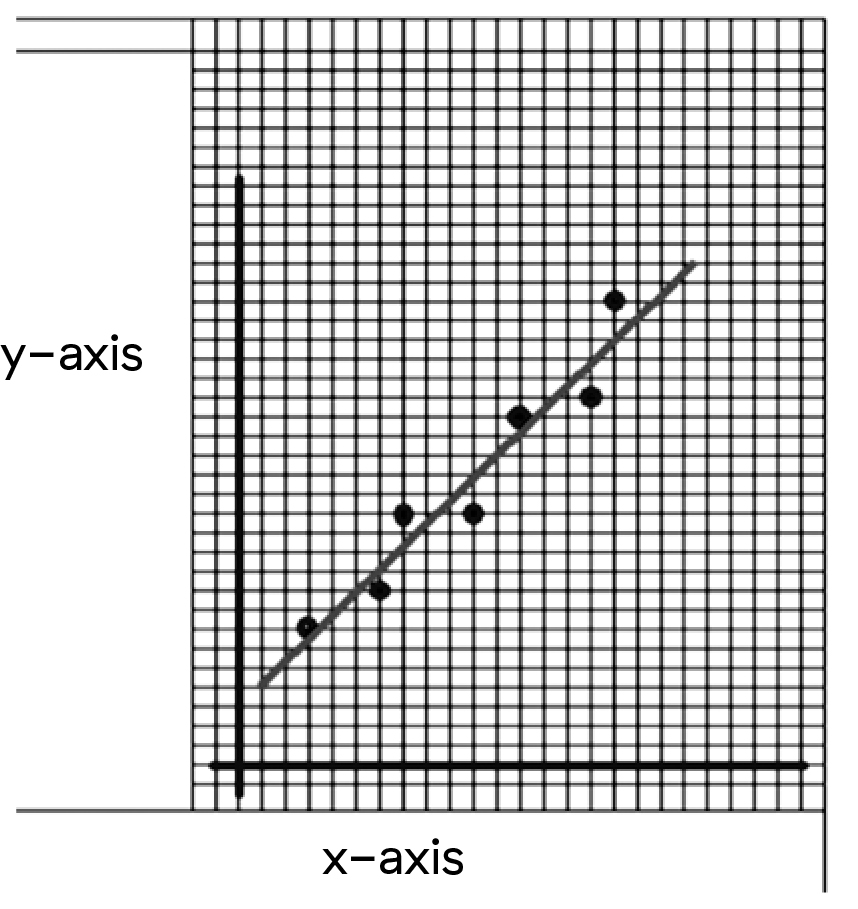
- Using data from the table, have your students create a graph of voltage versus current (V vs. I). Make sure they label all parts of their graph. Explain what a line of best fit is and have your students draw one on their graph.
- From the line of best fit, have your students calculate the slope of the line:
- Choose two points on the line (point A and point B).
- Calculate the difference between the voltages at the two points (the RISE of the slope).
- Calculate the difference between the current at the two points (the RUN of the slope).
- Divide the RISE by the RUN. This is the slope of the line.
- The resistance of a circuit is mathematically shown as an algebraic equation:
- Resistance = Voltage / Current.
Interpreting data
- Compare the slope of the graphs your students created with the stated resistance of the resistor you used. The numbers should be similar (different numbers are a result of individual differences in choosing a line of best fit).
- The relationship between voltage and current is Ohm’s Law, and the slope of the line from a graph of the two is the value of the resistance in the circuit. The Ohm’s Law equation can be represented in three ways:
- R = V / I (resistance = voltage divided by current)
- V = I x R (voltage = current x resistance)
- I = V / R (current = voltage divided by resistance)
Modify or extend this activity
- Have students take turns demonstrating the steps with the voltmeter and ammeter.
- The “Solving Ohm’s Law” activity continues the exploration of resistance and Ohm’s Law.
Curriculum Fit
Grade 9 Science
Content
- Voltage, current and resistance
- Circuits
Curricular competencies
Questioning and predicting
- Make observations aimed at identifying their own questions, including increasingly complex ones, about the natural world
Processing and analyzing data and information
- Seek and analyze patterns, trends, and connections in data, including describing relationships between variables (dependent and independent) and identifying inconsistencies
- Analyze cause-and-effect relationships
Evaluating
- Evaluate their methods and experimental conditions, including identifying sources of error or uncertainty, confounding variables, and possible alternative explanations and conclusions
Applying and innovating
- Transfer and apply learning to new situations
Communicating
- Formulate physical or mental theoretical models to describe a phenomenon
Assessments
Review the “Exploring Ohm’s Law” worksheet completed by your students, checking the accuracy of data recording, calculations and graphing.
Teaching Notes
Ohm’s Law represents the relationship between voltage and current. It is usually represented mathematically:
Where:
- V is the voltage (volts or V)
- I is the current (amperes or A)
- R is the resistance (ohms or Ω). Resistance is the ratio of voltage to current: V/I
It’s necessary to convert milliamperes (mA) to amperes (A) when using Ohm’s Law. There are 1,000 milliamperes (mA) in one ampere (A).
In order to represent Ohm's Law in a graph, use a line of best fit. These are used to show trends between sets of data and to show the relationship between various points on a scatter plot. Scatter plot graphs are commonly used with real-life data where data can be affected by the environment of the experiment.
The relationship between the dependent and independent variables can be described as a straight line if the relationship is linear in nature (often shown as a straight line graph).


